Dear Trader,
Hi this is Paul Wett from WettTraderllc.com. Thank you for your interest in WettTraderllc.com Weekly Top Chart for the Emini S&P 500. Below is the top chart for the week ending 7/20/2017.
The chart shows the spots were software entered and reverses. These are running on a real time demo account with auto-trade and execution. Hopefully this will should you just how powerful this software really is! And yes, we are working on an update for use with Tick data here is a sneak peek. Still work in progress.
Below is the market action for the 15 min WOW $650 from Monday to Thursday this week. And yes, this is fully auto and yes, I do not let run all the time unattended.
And over $2000 profit for the week up to Thursday.
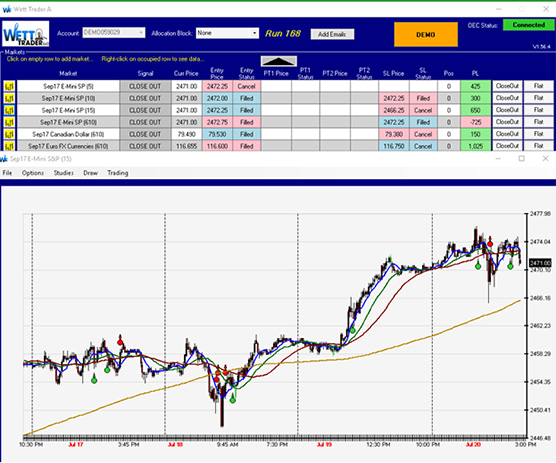
*** Above is the dashboard and the chart of the 15min that ran on auto execution moving averages 8/21 and trend box checked. PRICE AND TIME ALIGED WITH CONFIRMATION
And it managed to buy and sell on every pull-back. If your trading looks like this, then you can stop, I can’t help you. However, if you want to dial in on your overall trading performance then WettTraderllc.com is for you.
How do you trade? Once you get these signals on longer time frames with confirmation you can start really mopping up with a 5 min,15min,1hr, trades in same direction.
HOW MUCH DO YOU MAKE? YES THESE TRADES HAPPEN ALL THE TIME TAKE IT FOR A TEST DRIVE!!
You can trade full-time/part-time, you can trade the 5 min, 15 min, 20 min, 30 min, 60 min, 240 min. Hence increasing your chances with multiple time frames also multiple time frames widens ones’ perspective of the market. I believe this software is the most user-friendly price and time software available. Point and click set up!
So if you haven’t tried the demo, please click here I guarantee you will love the test drive.
Thanks Paul Wett
Speak Your Mind