Dear Trader,
Hi this is Paul Wett from WettTraderllc.com. Thank you for your interest in WettTraderllc.com Weekly Top Chart for the Emini S&P 500. Below is the top chart for the week ending 4/13/2017.
The chart shows the spots were software entered and reverses. These are running on a real time demo account with auto-trade and execution. Hopefully this will should you just how powerful this software really is!
Below is the market action for the 15 min WOW $1150 from Monday to Thursday this week. And yes, this is fully auto and yes I do not let run all the time unattended.

*** Above is the dashboard and the chart of the 15 min that ran on auto execution moving averages 8/21 and trend box checked. PRICE AND TIME ALIGED WITH CONFIRMATION
And it managed to buy and sell on every pull-back. If your trading looks like this, then you can stop, I can’t help you. However, if you want to dial in on your overall trading performance then WettTraderllc.com is for you.
Like this set up
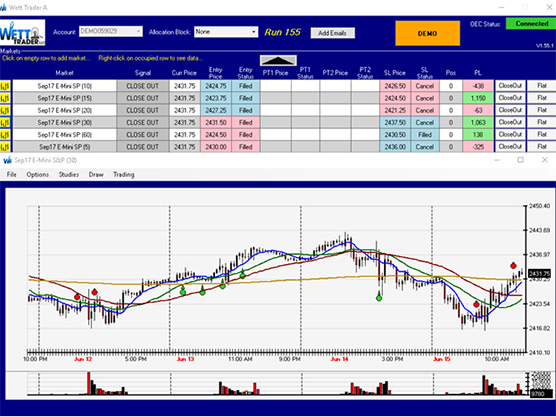
30 min $1063 all you do is hit flatten a price given in software. Take it for a test drive.
How do you trade? Once you get these signals on longer time frames with confirmation you can start really mopping up with a 5 min,15min,1hr, trades in same direction.
HOW MUCH DO YOU MAKE? YES THESE TRADES HAPPEN ALL THE TIME TAKE IT FOR A TEST DRIVE!!
You can trade full-time/part-time, you can trade the 5 min, 15 min, 20 min, 30 min, 60 min, 240 min. Hence increasing your chances with multiple time frames also multiple time frames widens ones’ perspective of the market. I believe this software is the most user-friendly price and time software available. Point and click set up!
So if you haven’t tried the demo, please click here I guarantee you will love the test drive.
Thanks Paul Wett
Speak Your Mind