Dear Trader,
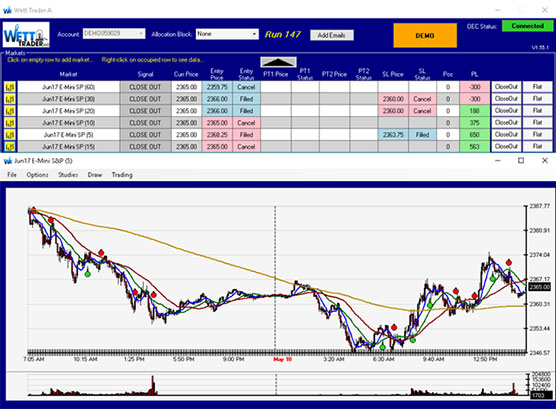
Hi this is Paul Wett from WettTraderllc.com. Thank you for your interest in WettTraderllc.com Weekly Top Chart for the Emini S&P 500. Below is the top chart for the week ending 5/18/2017.
The chart shows the spots were software entered and reverses. These are running on a real time demo account with auto-trade and execution. And with very little interference from me. Hopefully this will should you just how useful this software really is!
Below is the 5 min chart $650.00 for 2-day nice price action buys and sells as market turns. 15 min did $550.00 as well.
And it managed to buy on every pull-back. If your trading looks like this, then you can stop, I can’t help you. However, if you want to dial in on your overall trading performance then WettTraderllc.com is for you.
You can trade full-time/part-time, you can trade the 5 min, 15 min, 20 min, 30 min, 60 min, 240 min. Hence increasing your chances with multiple time frames also multiple time frames widens ones’ perspective of the market. I believe this software is the most user-friendly price and time software available. Point and click set up!
So if you haven’t tried the demo, please click here I guarantee you will love the test drive.
Thanks Paul Wett
Speak Your Mind